Only a fraction of ASX stocks
meet our investment criteria.
Star Stocks

Stock Doctor Star Stocks
Stocks identified for
growth or income.
The stocks we select for our Stock Doctor members and construct the Lincoln Managed Funds from are made up exclusively of our Star Stocks.
Stock Doctor Star Stocks are the healthiest blue chips and the most dynamic of small caps, often flying under the radar, yet to be discovered by most market participants. Many investors wished they heard about earlier.
Read the whitepaper
Download our white papers to gain expert insight into Lincoln Indicators' investment strategy - underpinned by our proprietary Financial Health Model - and learn how every investor can apply our approach to meet their investment goals.
Read the whitepaper Watch the video
Success Stories
Blue chips we found as small chips
Sometimes the best investments are hard to find amongst all the hype and opinion, but not when you invest in the numbers. We've uncovered plenty of amazing opportunities years before the rest of the market finds them.

Cochlear Limited (COH)
Based in Sydney, COH, a manufacturer of the nucleus Cochlear implant, was formed in 1981 with finance from the Australian government to commercialise the implants pioneered by Dr Graeme Clark in Melbourne during the 1970s.
We first flagged COH as a Star Growth Stock in 1997 based on its financial quality when its shares were largely undiscovered at only $4.80^.
Today, the company holds over two-thirds of the worldwide hearing implant market. COH was listed as one of the world’s most innovative companies by Forbes in 2011.
Research these companies
and more in Stock Doctor
Start now with a complimentary 14-day membership
- No credit card required
- Includes all features

REA Group Ltd (REA)
REA’s strong quantitative metrics led to its introduction as a Star Growth Stock in 2005 at $2.27^.
The company is now Australia’s number one property classifieds business with realestate.com.au having an average ~3x times more site visits compared to its nearest competitor, Domain. This market position allows it to generate strong profit margins and pricing power.
Growth is expected to continue with REA expanding its operations internationally into multiple geographies across Asia and North America.

CSL Limited (CSL)
CSL began life as a government enterprise charged with safeguarding the health of Australians fighting in World War I and was among the first to offer drugs such as insulin and penicillin to civilian citizens.
The company was listed on the ASX in 1994 and came to our attention as a Star Growth Stock in 1996 at $1.88^.
Through various acquisitions and constant innovation, the company has grown to become a global leader specialising in blood plasma products and flu vaccines.

Pro Medicus Limited (PME)
PME listed on the ASX in 2000 and provided clinical record-keeping software to the medical fraternity. The company experienced a step-change in growth when it acquired the medical imaging software Visage in 2009.
From humble beginnings, PME has since transformed into one of the leading healthcare imaging providers in North America, Europe and Australia.
We initially identified PME as a Star Stock back in 2006 at $1.55^.
^The share prices are shown as at close 30 June 2025. The share prices of Star Stock introduction are the closing prices on the date of introduction - COH (01/12/1997), CSL (01/09/1996), REA (30/08/2005) and PME (01/03/2006). Past performance is not a reliable indicator of future performance. Please note that each Star Stock appearing may have been removed or re-introduced as a Star Stock over time.
Lincoln, Lincoln Financial Group Pty Ltd and directors, employees and/or associates of these entities may hold interests in these ASX-listed companies. Further information about particular stocks held by these entities from time to time is disclosed within the Stock Doctor program and may change at any time without notice.
Star Stock performance
Proven through market cycles

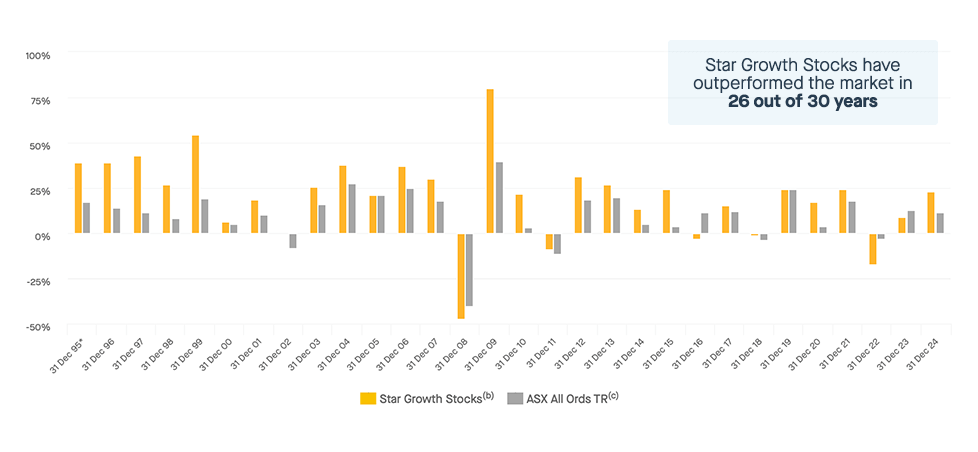
*The date of inception is 01/09/1995, the first year was only 3.81 months. The performance for this year has been annualised.
Stock Doctor Star Stocks have demonstrated a consistent track record of outperformance over the long term, reflecting the strength of their rigorous financial health methodology.
By focusing on fundamentally sound companies with strong balance sheets, sustainable earnings, and reliable cash flow, the strategy has successfully identified high-quality investment opportunities.
This disciplined approach has enabled Star Stocks to deliver superior returns compared to broader market benchmarks, navigating various market cycles with resilience.
The methodology prioritises both growth and income-focused stocks, catering to different investment objectives while maintaining a commitment to quality and long-term value creation.
Over the years, Star Stocks have stood out as a trusted guide for investors seeking robust and sustainable portfolio performance.
Star Stock evolution
Decades of established investment success
Since 1996, when Australian investors first accessed our proprietary quantitative research through the Stock Doctor platform, Lincoln Indicators has been dedicated to empowering individuals to build robust, growth-oriented portfolios. Our commitment to rigorous financial analysis has consistently identified high-quality companies, enabling investors to navigate the complexities of the market with confidence.
Recognising the diverse needs of our investors, in 2012, we expanded our offerings to include guidance on constructing income-focused portfolios. These model portfolios, comprising our carefully selected Star Stocks, have been designed to provide sustainable income streams while maintaining financial health and stability.
Over time, these income-oriented portfolios have demonstrated resilience and strong performance, reflecting our dedication to meeting the varied objectives of Australian investors.
Our Star Stocks are identified through a stringent selection process that evaluates companies based on financial health, past performance, and future outlook. This disciplined approach ensures that only fundamentally sound companies are included, aligning with our mission to support investors in achieving their financial goals through informed and our strategic investment framework.
Star Stock performance over the long-term.
-
Star Growth Stocks
-
Star Income Stocks
Cumulative value of $100,000 invested from (a) -
(a) 01/09/1995 is the inception date of the Star Growth Stock notional portfolio.
(b) This is the investment performance for each notional portfolio over the period shown and includes capital returns, dividend income and estimated transaction costs (but excludes distributions, fees, charges or tax). The portfolio assumes a full equities allocation at all times, the reinvestment of dividends and the rebalancing of the portfolio to equal weight each time a change is made to the notional portfolio (i.e. when stocks come in and out of the portfolio). All trades assume enough liquidity to purchase the required volume of stock at the close price on the day of a star stock in/out event or on a rebalance. These past performance figures are not a reliable indicator of future performance of the notional portfolio, or any stocks included in the portfolio. In shorter time periods, the investment performance of the notional portfolio can vary to the figures shown. You should not make investment decisions based on performance figures alone. For more detailed information about how these figures are calculated, including the assumptions used, click here.
(c) ASX All Ordinaries Accumulation and S&P/ASX Small Ordinaries Accumulation indexes are sourced from Standard and Poors.
Cumulative value of $100,000 invested from (a) -
(a) 07/08/2012 is the date of inception of the Star Income Stock notional portfolio.
(b) This is the investment performance for each notional portfolio over the period shown and includes capital returns, dividend income and estimated transaction costs (but excludes distributions, fees, charges or tax). The portfolio assumes a full equities allocation at all times, the reinvestment of dividends and the rebalancing of the portfolio to equal weight each time a change is made to the notional portfolio (i.e. when stocks come in and out of the portfolio). All trades assume enough liquidity to purchase the required volume of stock at the close price on the day of a star stock in/out event or on a rebalance. These past performance figures are not a reliable indicator of future performance of the notional portfolio, or any stocks included in the portfolio. In shorter time periods, the investment performance of the notional portfolio can be vary to the figures shown. You should not make investment decisions based on performance figures alone. For more detailed information about how these figures are calculated, including the assumptions used, click here
(c) Yield is the average dividend yield of the notional portfolio over the period shown.
(d) S&P/ASX 200 Accumulation and Yield index is sourced from Standard and Poors.
