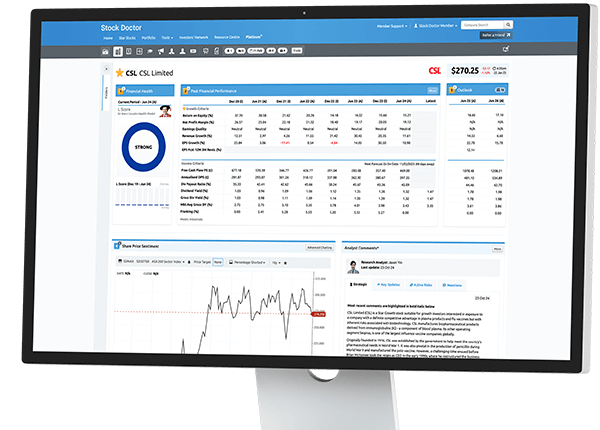
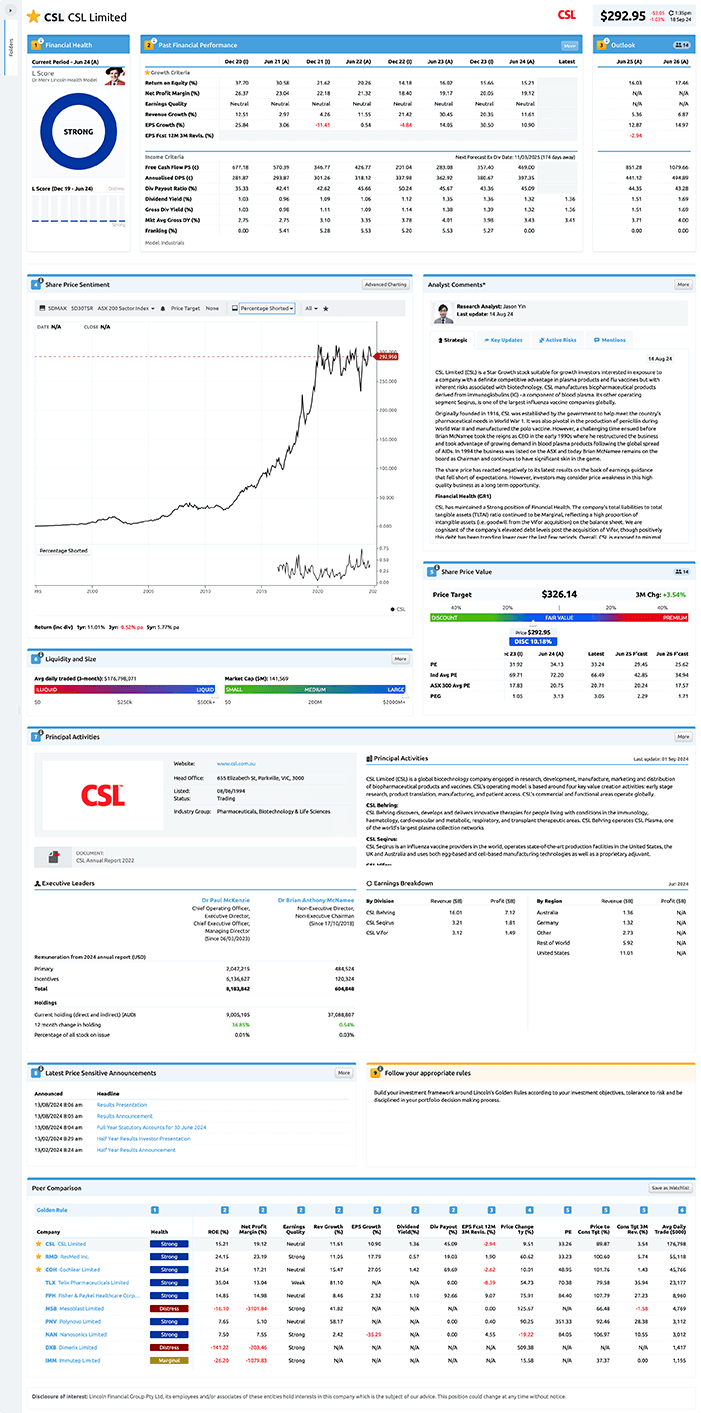
The 9 Golden Rules framework the power behind Stock Doctor Star Stocks.

The 9 Golden Rules
A framework to help you invest with confidence, control and peace of mind
Our proprietary research methodology analyses the financial statements of every company on the Australian stock exchange mostly within 24 hours of the results being released. These statements aren’t opinion or hype: they’re facts.
Facts that allow us to quickly screen over 2,000 Australian stocks to a more manageable universe of 50-70 Star Stocks for your investment consideration. The benefit of this process is to ensure efficiency, objectivity and accountability in our stock selection process.
Primary Rules
1 Golden Rule 1
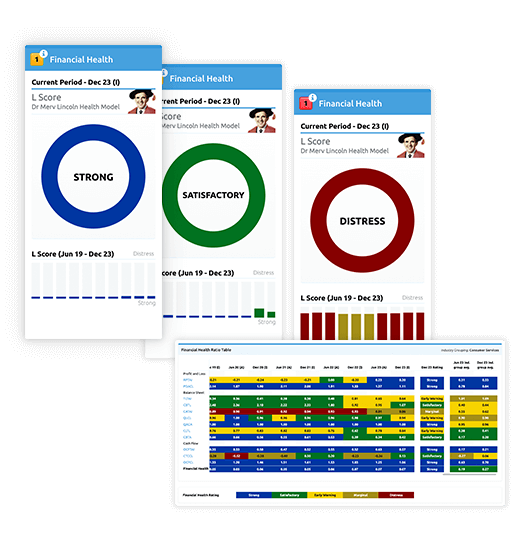
Financial Health
The Financial Health model is the most important layer within Stock Doctor’s investment framework.
Our algorithm is an academically validated quantitative filter that calculates industry-specific profit, debt, asset, equity and cash flow ratios and excludes the 75% of ASX-listed companies from your investment universe that are statistically vulnerable to insolvency.
Invest in the numbers
Learn about Dr Merv Lincoln’s academically proven methodology.
2 Golden Rule 2
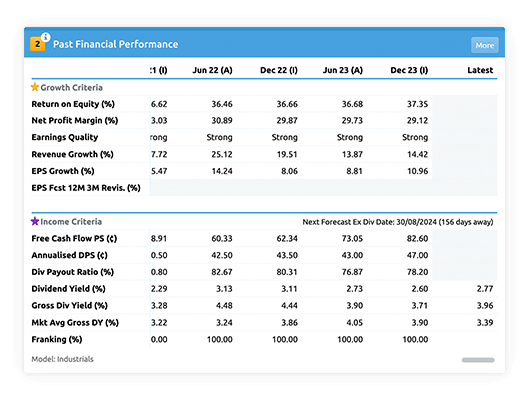
Financial Performance
The Financial Health model removes the vulnerable, the next layer in our framework helps identify the highest financial-performing companies available on the ASX share market.
Depending on the sector, we aim to isolate companies that demonstrate adequate levels of capital efficiency, earnings quality and profitability. The trend line in these metrics is also important!
3 Golden Rule 3
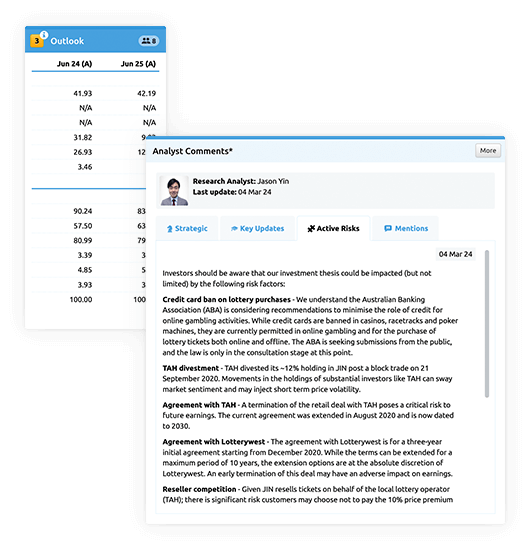
Outlook and Active Risks
A qualitative assessment is applied to explore all the currently active business risks and whether these risks could negatively impact the business’ performance and outlook in the year ahead.
Our team of in-house research analysts spend significant time talking to management, attending industry events, and speaking to industry peers to determine whether a business will likely meet the grade moving forward.
Read the whitepaper
Download our white papers to gain expert insight into Lincoln Indicators' investment strategy - underpinned by our proprietary Financial Health Model - and learn how every investor can apply our approach to meet their investment goals.
Read the whitepaper Watch the video
Start now with a complimentary 14-day membership
- No credit card required
- Includes all features
Supporting Rules
4 Golden Rule 4
Share Price Sentiment
5 Golden Rule 5
Share Price Value
Our Star Stock selection process dictates that we believe investors should be comfortable paying a premium price for a for a high-quality business. Those stocks that trade at significant discounts to consensus price targets are usually stocks with poor Financial Health and high active risks which could instigate further share price falls and downward price target revisions in the future – this phenomenon is often called “value traps”.
6 Golden Rule 6
Liquidity and Size
7 Golden Rule 7
Principal Activities
8 Golden Rule 8
Latest Price Sensitive
Announcements
Announcements that validate a business’ growth thematic and/or support a commitment and consistency around dividend distribution are preferred.
9 Golden Rule 9
Follow your Appropriate Rules
Build your investment framework around Lincoln’s Golden Rules according to your investment objectives, tolerance to risk and be disciplined in your portfolio decision making process.
Plus
access over 450+ data points per report for all
ASX listed companies, ETFs and LICs.
The 9 Golden Screen is our curated view displaying the financial metrics for our quantitative methodology alongside our qualitative rationale so you can invest in the numbers.
But we also give you full access to the data, so you can drill down deep and look under the hood.
-
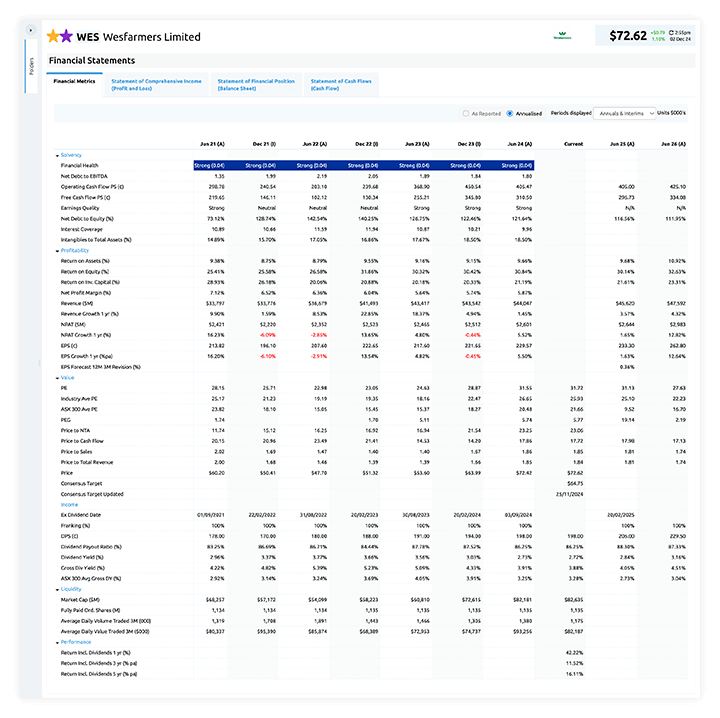
Financial Metrics
The Financial Metrics table provides a useful summary of financial information and ratios for a selected company over time and includes two years of forecast figures where available.
-
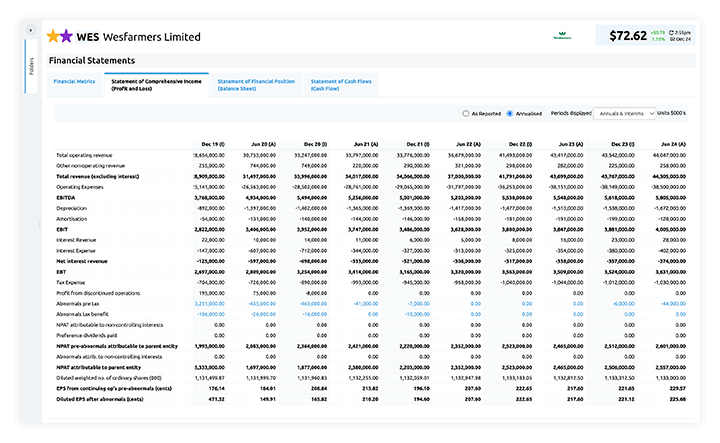
Profit and Loss
Assess the profitability of the company, and go back through history to see the company's record of earning profit for shareholders.
-
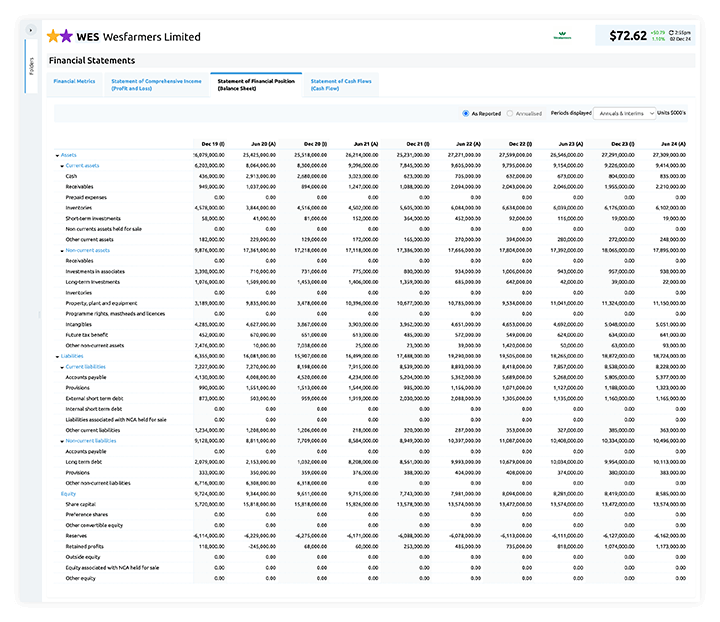
Balance Sheet
Assets, Liabilities or Net Assets to drill down further in a company’s balance sheet.
-
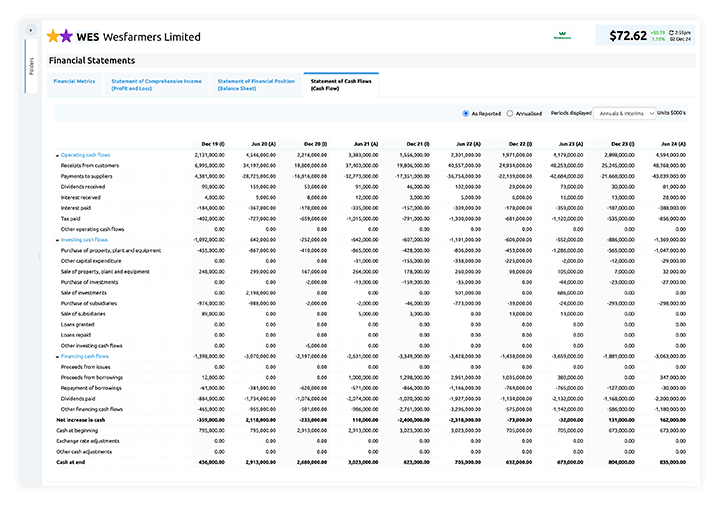
Cash Flow
The information in this financial statement is usually separated into three sections, as well as a summary of the flow of cash during the period, and a high level reconciliation of the cash at the beginning of the period to the end of the period.
-
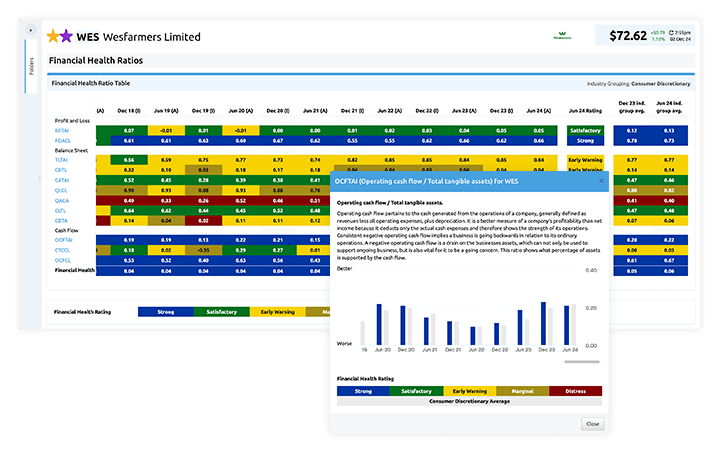
Financial Health Ratios
The most important aspect of Stock Doctor is the unique Financial Health methodology used to analyse each company’s Balance Sheet, Cash Flow and Profit and Loss statements. Dr Merv Lincoln’s academically proven methodology, developed after years of industry research and covering three economic cycles, is also widely used by corporate Australia in the area of risk management.
-
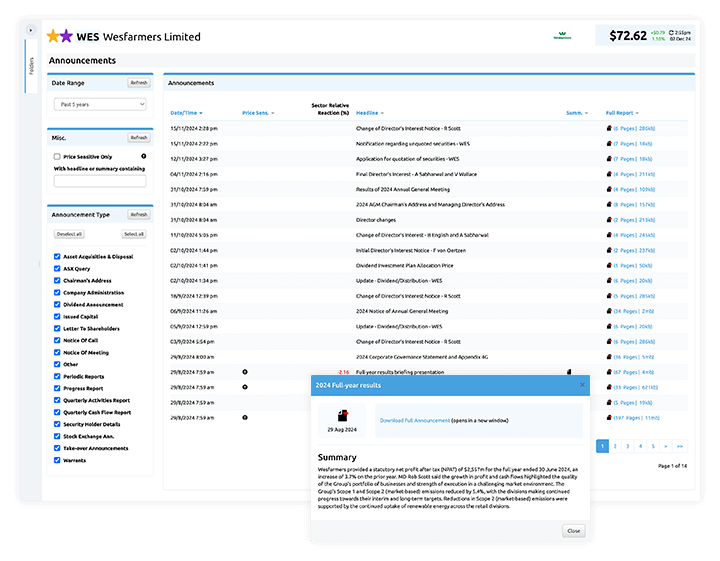
Announcements
Access to full PDFs of every announcement made by an ASX listed company since 1999.
-
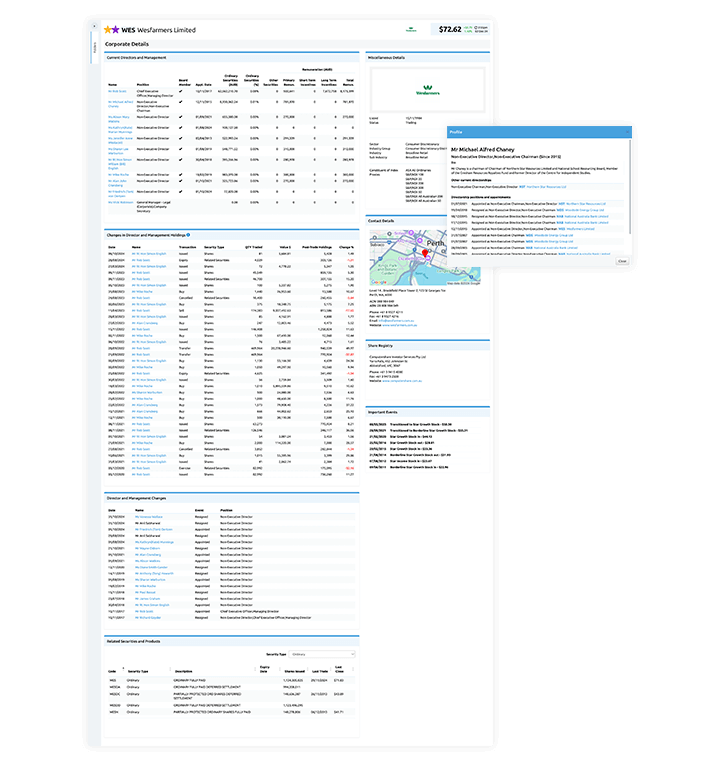
Corporate Details
Enhance your knowledge of a Company and gain further Investment Insight, and enable you to further Research a Company. For example, you may wish to visit a Company’s website, Contact a Company’s Share Registry, or Contact the Company directly. You will find an insightful description of Principal Business Activities, details of Directors and Management and their Shareholdings in the Entity, Director Remunerations and Events Important to the Company.
-
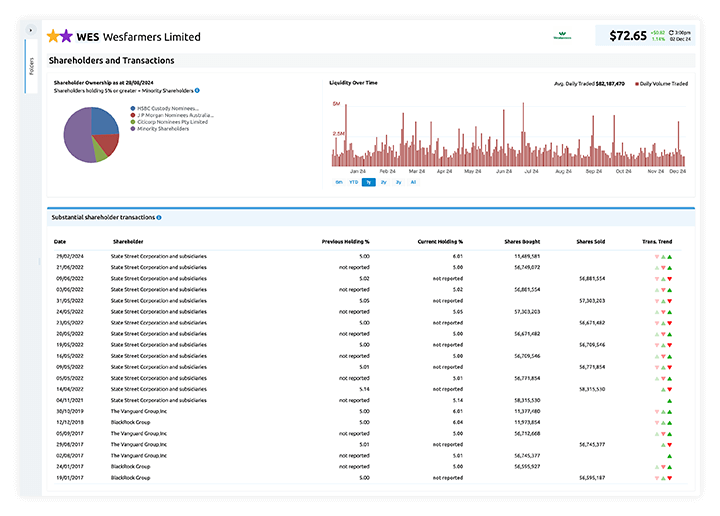
Shareholders and Transactions
Shareholder ownership, liquidity over time and transactions movements of substantial shareholders.
-
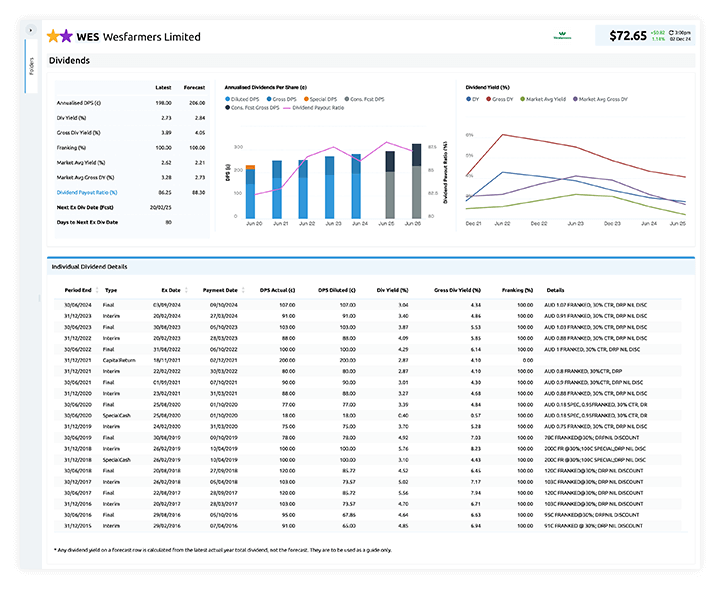
Dividends
Current and forecasts dividend amounts, dividend yields, broader market yields, franking, dividend cover ratio and ex-dividend date.


